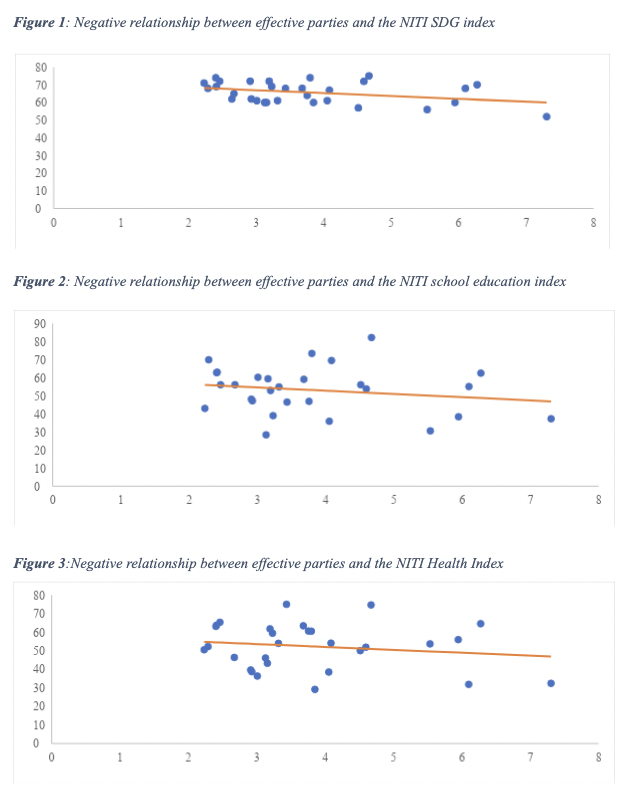
States in India have different number of political parties contesting Vidhan Sabha (or state) elections. This article looks to explore if there is a relationship between the number of parties contesting elections in a state, and the quality of governance and quantity of public goods provisioned in that state.
Chhibber & Nooruddin (2004) suggests that states with a fewer number of political parties tend to provide a greater quantity of public goods and services to individuals residing in that state. They argue that states with two-party systems (fewer political parties) have to cater to a variety of interest, religious and caste groups and are therefore more likely to provide public goods in an attempt to win elections. In contrast, states with a multi-party system (more political parties) are likely to cater to particular social groups, and therefore provide club and private goods (goods that exclude particular social groups) to win elections. Similarly, this can be validated by Banerjee and Somanathan (2007) who assert that public goods are not uniformly distributed amongst various disadvantaged social groups in India. For instance, their findings suggest that Scheduled Caste (SC) groups were able to extract more public goods as compared to Scheduled Tribe (ST) groups in the 1980s, as SC parties rose to prominence.
In this article, I will provide further evidence to strengthen the claim made by the aforementioned researchers. I will do this by first calculating the Effective Number of Parties (ENP) for each state from the most recent state election. ENP will be calculated utilising a mathematical expression invented by Laakso & Taagepera (1979) and pairing them with proxies which will indicate the quality of governance and quantity of public goods and services provided by a state. The proxy for the quality of governance in a state will be the Sustainable Development Goals (SDG) Index created by NITI Aayog. As for public goods and services, I will look specifically at education and health services. The proxy for education provision in each state will be the School Education Quality Index (SEQI) published by NITI Aayog and the proxy for health services will be the NITI Health Index.
Assumptions and Limitations
The index score corresponding to each state will be a proxy that measures how competently the state is governed and the quantity of public goods which are being provided by the state. It is important to note that these indices are just proxies, and they do not capture all the relevant information which would be required to make this assessment. For instance, some indicators to calculate the index score for some of the states are missing and therefore the accuracy of the indicators utilised should not be held as sacrosanct. However, I will continue with the assumption that these indices effectively capture the quality of governance and quantity of public goods provided in the state, in this article, for ease of analysis.
There are various factors which determine how competently a state is governed or the quantity of public goods being provided. This might include historical factors like the institutions in place in the respective state, the competence of the bureaucracy present in the state, the socio-economic conditions of the individuals residing in the state etc. These are factors which are often not controlled by the current government in power, and this paper does not seek to make any causal claims. Another important consideration is the constitutional listing of different public goods, for instance, health is on the state list of the constitution, whereas education is on the concurrent list. Therefore, while the union government can be treated as a constant for all states, it is noteworthy that often financing considerations by the Finance Commission results in different allocations of funds to state governments. This paper simply looks at the nature of the relationship between the effective number of parties contesting state elections in a state, and the quality of governance and quantity of public goods or services provided to individuals residing in that state.
In addition, it is important to note that the data utilised to capture the effective number of parties is from the most recent state election held in the state, and the time periods differ from state to state. For instance, the state election data utilised for the West Bengal Elections are from 2021. Whereas, the state election data utilised for Punjab is from 2017, as Punjab is set to go in for state elections next year, in 2022. In contrast, the indices utilised in this paper are from a single time period, for instance, the NITI SDG index scores are for the year 2020. Similarly, the SEQI is from the year 2016-17, the health index is from 2017-18. Therefore, there is a time difference in the data utilised. The assumption made in this paper is that effective number of parties in a state election do not vary much in a limited time horizon (five to ten years) and that is a determining factor on the state of governance and quantity of public goods or services provided by the state.
Findings

The figures above clearly show that there exists a negative linear relationship between the effective number of parties contesting state elections and the quality of governance and quantity of public goods and services provisioned by the state. Therefore, they indicate that social heterogeneity and a greater number of political parties in a state, is associated with lower quality governance and lesser public goods and services provisioned in that state.

